


The Jordan, Knauff & Company (JKC) Valve Stock Index was up 8.1 percent over the last 12 months, while the broader S&P 500 Index was up 11.9 percent. The JKC Pump Stock Index increased 2.5 percent for the same time period.1
The Institute for Supply Management’s Purchasing Managers’ Index (PMI) declined from 60.8 percent in February to 59.3 percent in March. The data for new orders and production was down slightly for the month but has been above 60 percent since June of last year. Despite some decreases, exports at 58.7 percent and employment at 57.3 percent still remain healthy. Prices for raw materials were up from 74.2 percent to 78.1 percent, a level not seen since April 2011.
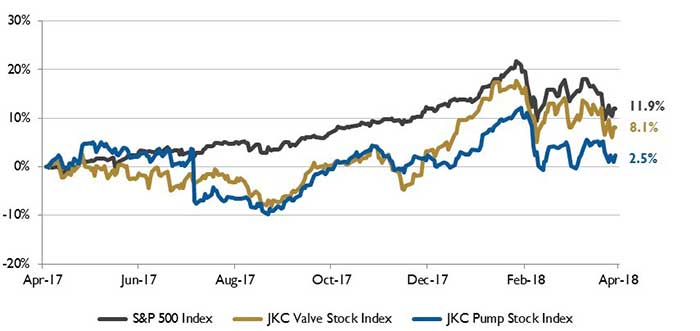 Image 1. Stock Indices from April 1, 2017 to March 31, 2018. Local currency converted to USD using historical spot rates. The JKC Pump and Valve Stock Indices include a select list of publicly traded companies involved in the pump and valve industries, weighted by market capitalization. Source: Capital IQ and JKC research.
 The U.S. economy gained just 103,000 new jobs in March, much lower than February’s revised increase of 326,000 jobs. On average the economy added an average of 202,000 jobs a month for the first quarter, faster than the average gains in both 2017 and 2016. The strongest gains for the month took place in manufacturing (22,000), health care (22,000) and professional firms (33,000).
U.S. total net energy imports fell 35 percent in 2017 versus 2016 and were at their lowest levels since 1982, due mostly to a 27 percent increase in gross energy exports which rose to 18.0 quadrillion British thermal units (Btu) in 2017, the highest annual level of energy exports on record. Led by production increases in renewable energy (8 percent), coal (6 percent), natural gas plant liquids (6 percent), crude oil (5 percent) and natural gas (1 percent), an increase in total U.S. energy production also contributed to the decline in net energy imports. Gross energy imports have been decreasing from a high of 34.7 quadrillion Btu in 2007.
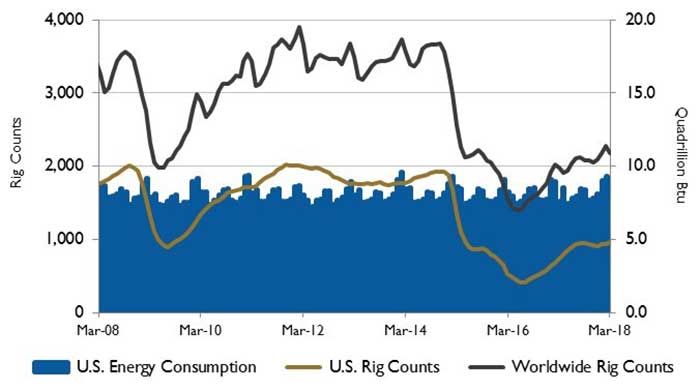 Image 2. U.S. energy consumption and rig counts. Source: U.S. Energy Information Administration and Baker Hughes Inc.
In 2017, fossil fuel exports from the U.S. increased substantially with exports of crude oil 89 percent higher than in 2016, coal 61 percent higher, natural gas 36 percent higher and petroleum products 11 percent higher than in 2016. U.S. exports of liquefied natural gas (LNG) quadrupled from 0.5 billion cubic feet per day in 2016 to 1.94 billion in 2017. More than half of LNG exports went to three countries: Mexico, South Korea and China. With four additional LNG export capacity projects scheduled to be completed within the next two years, U.S. LNG export capacity is expected to reach 9.6 billion cubic feet per day by the end of 2019. The U.S. is projected to become the third-largest LNG exporter in the world by 2020, behind only Australia and Qatar.
In March, the Dow Jones Industrial Average, the S&P 500 Index and the NASDAQ Composite decreased by 3.5 percent, 2.7 percent and 2.9 percent, respectively. In the first quarter, the Dow and S&P 500 lost 2.3 percent and 1.2 percent, respectively, while the NASDAQ gained 2.3 percent. Stocks suffered due to the administration’s tariff policies and the tech fall. Facebook and Amazon both took large stock hits.
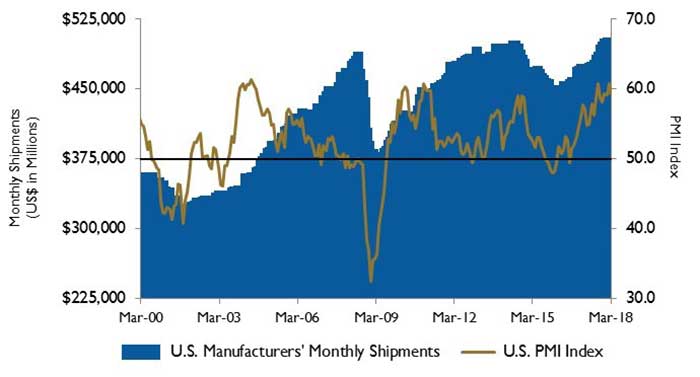 Image 3. U.S. PMI and manufacturing shipments. Source: Institute for Supply Management Manufacturing Report on Business and U.S. Census Bureau.
These materials were prepared for informational purposes from sources that are believed to be reliable but which could change without notice. Jordan, Knauff & Company and Pumps & Systems shall not in any way be liable for claims relating to these materials and makes no warranties, express or implied, or representations as to their accuracy or completeness or for errors or omissions contained herein. This information is not intended to be construed as tax, legal or investment advice. These materials do not constitute an offer to buy or sell any financial security or participate in any investment offering or deployment of capital.
Reference
1. The S&P Return figures are provided by Capital IQ.