


The Jordan, Knauff & Company (JKC) Valve Stock Index was down 19.3 percent over the last 12 months, while the broader S&P 500 Index was up 1 percent. The JKC Pump Stock Index fell 15.2 percent for the same time period.1
The Institute for Supply Management’s Purchasing Managers’ Index (PMI) registered 49.1 percent in August, a decrease of 2.1 percentage points from July, falling into contraction territory for the first time since 2016. The New Orders Index was 47.2 percent, a decrease of 3.6 percentage points, reaching the low set in 2012. The Production Index decreased 1.3 percentage points to 49.5 percent.
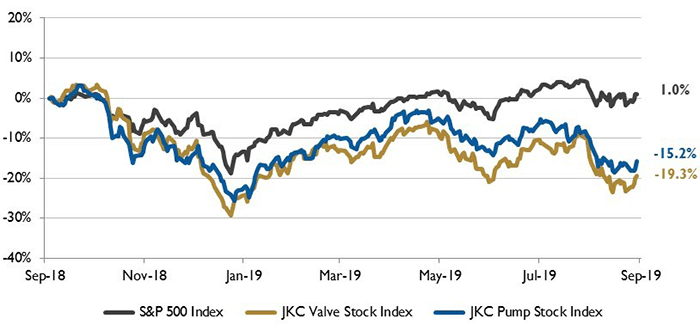 Image 1. Stock indices from Sept. 1, 2018, to Aug. 31, 2019. Local currency converted to USD using historical spot rates. The JKC Pump and Valve Stock Indices include a select list of publicly traded companies involved in the pump and valve industries, weighted by market capitalization. Source: Capital IQ and JKC research.
 Survey respondents’ references to the trade war and tariffs were widespread across industries and remains a significant issue as indicated by the strong contraction in New Export Orders, which fell 4.8 percentage points to 43.3 percent. Of the 18 manufacturing industries surveyed, only nine reported growth in August.
U.S. industrial production slowed 0.2 percent in July although the prior month’s reading was revised upward by 0.2 percent. Manufacturing output fell 0.4 percent in July, the fifth monthly decline in the first seven months of the year. The trade war with China and the related slowdown in global growth have weighed on the sector.
U.S. petroleum and natural gas production increased by 16 percent and by 12 percent, respectively, in 2018, one of the largest absolute petroleum and natural gas production increases from a single country in history.
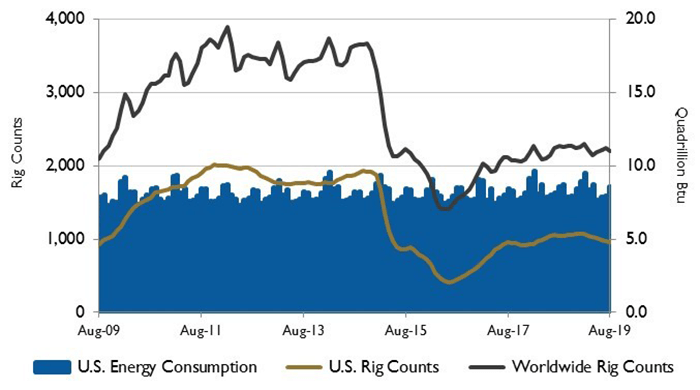 Image 2. U.S. energy consumption and rig counts. Source: U.S. Energy Information Administration and Baker Hughes Inc.
U.S. crude oil production increased by nearly 11 million barrels per day, with production in the Permian region of western Texas and eastern New Mexico contributing most of the growth.
U.S. natural gas production increased to 28.5 billion cubic feet per day, reaching a new record high for the second year in a row. Ongoing growth in liquefied natural gas export capacity and the expanded ability to reach new markets supported increases in this production.
Due to increasing global demand, Russia’s crude oil and natural gas production also reached record levels in 2018. Russia exports most of the crude oil that it produces to European countries and to China. Russia’s natural gas production increased by 7 percent in 2018, which exceeded its growth in exports.
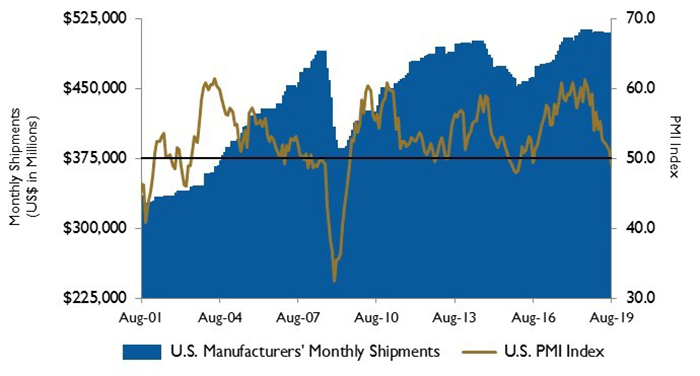 Image 3. U.S. PMI and manufacturing shipments. Source: Institute for Supply Management Manufacturing Report on Business and U.S. Census Bureau
Saudi Arabia’s annual average crude oil production increased slightly in 2018, but it remained lower than its crude oil output record high in 2016.
On Wall Street, the Dow Jones Industrial Average, the S&P 500 Index and the NASDAQ Composite lost 1.7 percent, 1.8 percent and 2.6 percent, respectively, in August.
The intensifying trade conflict between the U.S. and China was a concern for equity market investors as China announced import duties on U.S. agricultural products.
Reference
1. The S&P Return figures are provided by Capital IQ.
These materials were prepared for informational purposes from sources that are believed to be reliable but which could change without notice. Jordan, Knauff & Company and Pumps & Systems shall not in any way be liable for claims relating to these materials and makes no warranties, express or implied, or representations as to their accuracy or completeness or for errors or omissions contained herein. This information is not intended to be construed as tax, legal or investment advice. These materials do not constitute an offer to buy or sell any financial security or participate in any investment offering or deployment of capital.