


The Jordan, Knauff & Company (JKC) Valve Stock Index was down 10.9 percent over the last 12 months, while the broader S&P 500 Index was up 5.3 percent. The JKC Pump Stock Index fell 10.4 percent for the same time period.1
The Institute for Supply Management’s Purchasing Managers’ Index (PMI) fell to 50.1 percent in February from 50.9 percent in January. The New Orders Index registered 49.8 percent, a decrease of 2.2 percentage points. The Production Index was down 4 percentage points, registering 50.3 percent.
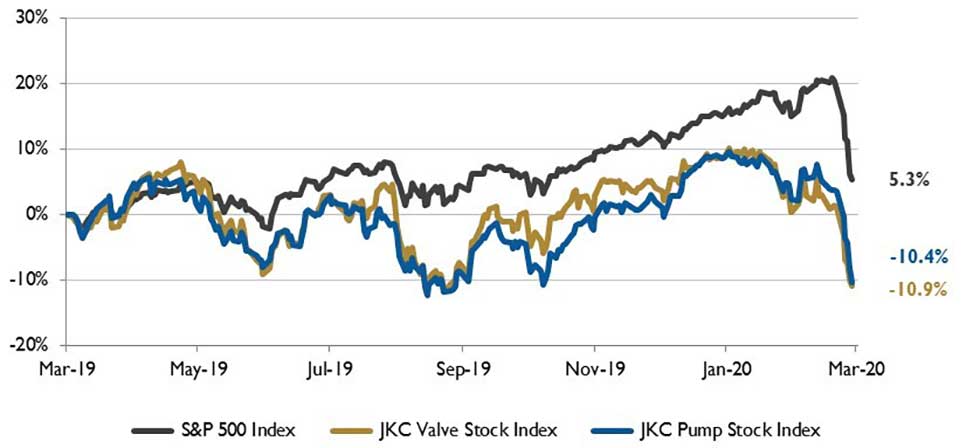 IMAGE 1: Stock Indices from March 1, 2019 to Feb. 29, 2020. Local currency converted to USD using historical spot rates. The JKC Pump and Valve Stock Indices include a select list of publicly traded companies involved in the pump and valve industries, weighted by market capitalization. Source: Capital IQ and JKC research.
The Employment Index rose to 46.9 percent, an increase of 0.3 percentage points. The New Export Orders Index decreased 2.1 percentage points, falling to 51.2 percent. Most, if not all, of the manufacturing industry sectors were impacted by global supply chains. Among the six big industry sectors, food, beverage and tobacco products remained the strongest.
The weakest sector was petroleum and coal products. Overall, survey respondents this month were marginally positive regarding near-term growth.
Despite improvement in the PMI and the Phase I trade deal reached between the United States and China, industrial sector production fell for the third time in four months in January, with total production falling 0.3 percent. After another warm winter month, some weakness can be tied to a 4 percent drop in utilities output. Aircraft and parts declined 10.7 percent in January.
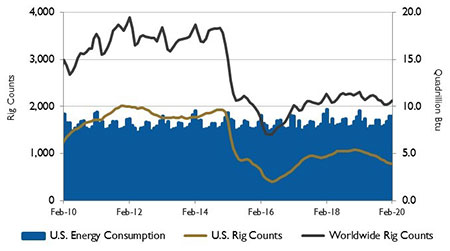 IMAGE 2: U.S. energy consumption and rig counts. Source: U.S. Energy Information Administration and Baker Hughes Inc.
Offsetting aircraft production was a 0.8 percent increase in computers and electronics. Another source of strength in January was a 2.4 percent increase in motor vehicles and parts.
The U.S. Energy Information Administration (EIA) estimates that the novel coronavirus (COVID-19) will reduce China’s total petroleum and liquid fuels demand by an average of 190,000 barrels per day. This latest estimate of 2020 global liquid fuels demand is 378,000 barrels per day less than was forecast in January.
The difference between the forecasts is driven by a combination of lower-than-expected heating fuel consumption caused by the Northern Hemisphere’s warmer-than-expected winter, an expected slowing of economic growth in general, and the particular economic effects of the COVID-19 outbreak.
Economic growth in China will rebound once COVID-19’s impact has faded, and the EIA expects petroleum demand to approach the levels forecast in January near the end of the year.
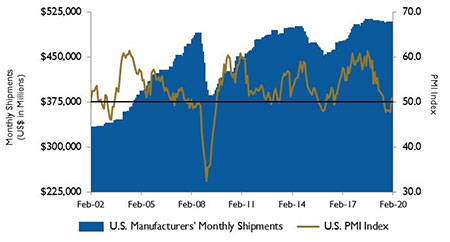 IMAGE 3: U.S. PMI and manufacturing shipments. Source: Institute for Supply Management Manufacturing Report on Business and U.S. Census Bureau
On Wall Street, the Dow Jones Industrial Average lost 10 percent, the S&P 500 Index fell 8.4 percent while the NASDAQ Composite slipped 6.4 percent for the month of February. The coronavirus scare pushed investors into defensive stocks and safe haven assets like treasury bonds and gold.
Several companies have downgraded their outlook for growth and corporate earnings due to the virus. South Korea, Japan and Italy have closed factories as confirmed COVID-19 cases are rising in these countries.
Reference
1-The S&P Return figures are provided by Capital IQ.